TL;DR
- What it is: Five 2026 B2B sales intelligence benchmarks — email deliverability, phone connect rate, contact coverage per deal, CRM data accuracy, and signal response SLA — built from Lusha’s live database of 300M+ verified contacts plus third-party research from Gong, Salesloft, Forrester, Salesforce, and Experian.
- Key finding: Verified direct dials connect at 12–18% versus just 2–4% for general company lines, and deals with three or more verified stakeholders engaged close at 2.8x the rate of single-threaded deals.
- Why it matters: 47% of lost B2B deals were single-threaded, 62% of reps say stale CRM data has cost them a deal, only 29% of revenue teams have a formal data quality process, and bad data wastes an average of 21% of marketing budget.
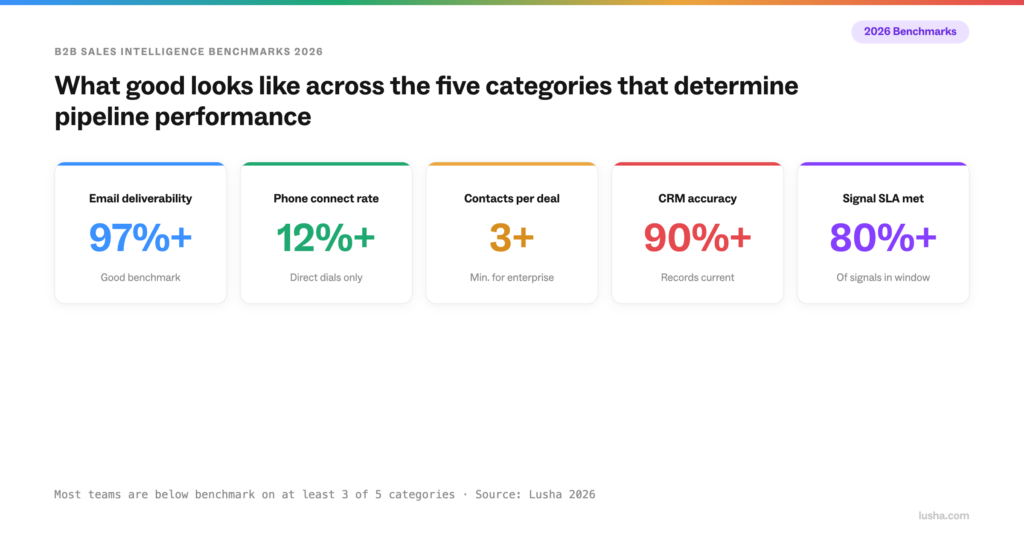
- Bottom line: Teams operating at benchmark keep email deliverability at 97%+, phone connect rate at 12%+, 3+ verified contacts per active deal, 90%+ CRM data accuracy, and hit the response SLA on 80%+ of buying signals.
Published: June 2026
Data source: Lusha live database — 300M+ verified contacts, pulled June 1, 2026. Third-party benchmarks sourced from Gong, Salesloft, Forrester, TechTarget, Salesforce, and Experian — sources cited per stat.
Methodology note: Lusha benchmarks are based on verified contact data in the Lusha database. Third-party benchmarks reflect published research from the cited sources. All benchmarks represent B2B sales contexts unless otherwise noted.
Executive summary
Most B2B sales benchmarks tell you what the average team achieves. This report tells you what good looks like — and what the data behind good performance actually requires.
Four benchmark categories define whether a revenue team is working from reliable data or gradually burning down its pipeline:
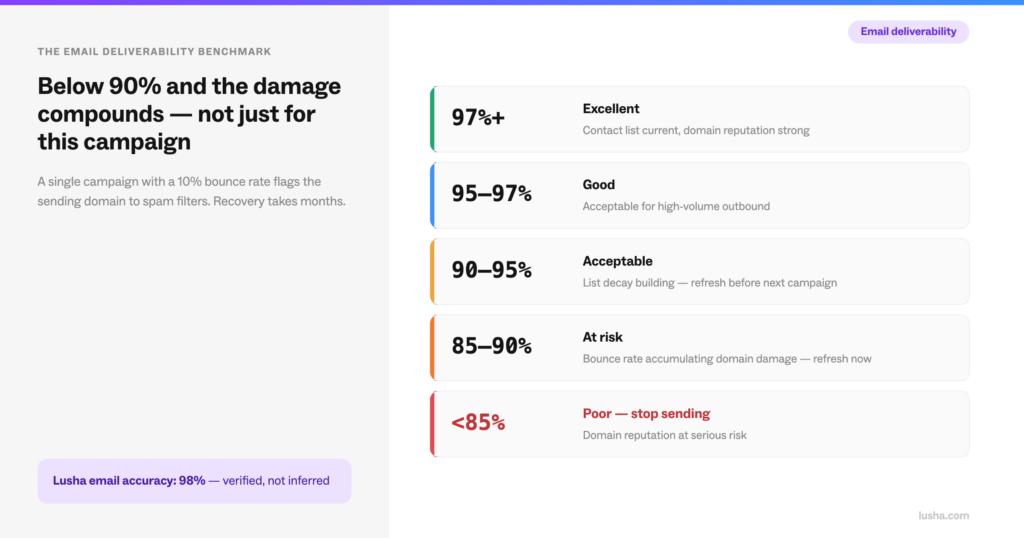
Email deliverability. Good is above 95%. Below 90% and sender domain reputation begins compounding damage that affects every future send — not just the campaign that triggered the bounces.
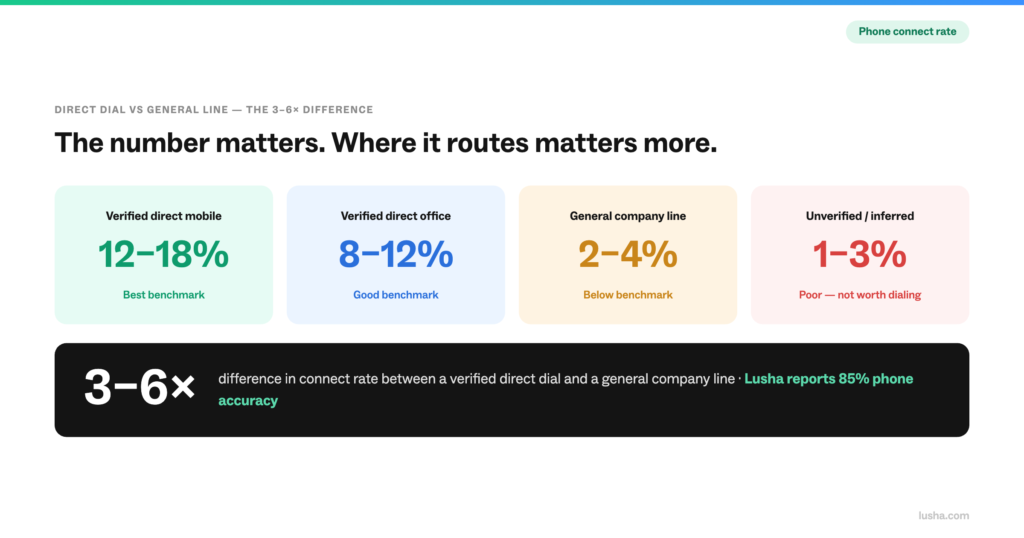
Phone connect rate. The difference between a direct dial and a general line is the difference between a 12%+ connect rate and a 2–4% connect rate. The number matters. Where the number routes matters more.
Contact coverage per deal. Gong’s research puts it plainly: deals with three or more stakeholders engaged close at 2.8x the rate of single-threaded deals. 47% of lost deals were single-threaded. The benchmark is three verified contacts per active deal — not one.
CRM data accuracy. 62% of sales reps say stale data has cost them a deal. Only 29% of revenue teams have a formal data quality process. The gap between those two numbers is where pipeline disappears.
The report covers benchmarks for each category, what good looks like, what the floor is before performance degrades, and what data inputs are required to reach the benchmark.
Email deliverability benchmarks
What the numbers mean
Email deliverability is the percentage of sent emails that reach the intended inbox without bouncing. It is determined by two factors: sender domain reputation and the accuracy of the contact list.
Sender domain reputation is built over time and damaged fast. A campaign that produces a 10% bounce rate does not just fail — it flags the sending domain to spam filters, reducing deliverability on all future sends from that domain. A domain that has been flagged takes months to recover.
Contact list accuracy is where data quality determines deliverability before a single email is sent.
The benchmark tiers
| Deliverability rate | Status | What it means |
|---|---|---|
| 97%+ | Excellent | Contact list is current, domain reputation strong |
| 95–97% | Good | Acceptable for high-volume outbound |
| 90–95% | Acceptable | Some list decay — refresh recommended before next campaign |
| 85–90% | At risk | Bounce rate accumulating domain damage — immediate refresh required |
| Below 85% | Poor | Domain reputation at serious risk — pause sends, clean list |
The bounce rate floor
| Bounce rate | Status |
|---|---|
| Under 2% | Good — standard for well-maintained lists |
| 2–5% | Acceptable — monitor and refresh |
| 5–10% | Poor — domain reputation damage beginning |
| Over 10% | Critical — stop sending, clean the list immediately |
What Lusha delivers
Lusha’s email accuracy rate is 98% — verified against a live, continuously refreshed database before every address is surfaced. Every contact returned has a confirmed current email, not an inferred format.
A 98% accuracy rate means a list built entirely from Lusha data starts at 2% potential bounce exposure before any time-based decay. A list built from format-inferred data starts at 25–40% potential bounce exposure before the first send.
The SDR email benchmark
The average B2B SDR email open rate is 23.9% and the average reply rate is 3.1%, according to Salesloft’s 2024 benchmark report. These averages reflect the full population — including teams sending to stale lists. Teams operating with verified contact data and strong deliverability consistently outperform both benchmarks.
Reply rate is the metric that matters most. Open rate is affected by email preview and tracking changes. Reply rate reflects genuine engagement — and reply rate is directly correlated with how well the message is personalized to a current, verified contact rather than a stale record.
Phone connect rate benchmarks
Direct dials vs general lines
The single biggest variable in phone connect rate is not messaging, timing, or cadence. It is whether the number dialed reaches the person directly or routes through a switchboard.
| Number type | Connect rate benchmark |
|---|---|
| Verified direct mobile | 12–18% |
| Verified direct office line | 8–12% |
| General company line | 2–4% |
| Unverified / format-inferred | 1–3% |
The difference between a verified direct dial and a general line is 3–6x in connect rate. A team making 100 calls per rep per week sees 12–18 conversations from verified direct dials and 2–4 conversations from general lines. Over a quarter, that difference compounds into a pipeline gap that is visible in the numbers but not always attributed to the right cause.
The cold call benchmark
The average cold call connect rate in B2B is 7–9%, according to Gong’s 2024 benchmark data. The average number of meetings booked from cold calls is 0.3–0.5 per 100 dials.
These averages include teams dialing general company lines. Teams dialing verified direct mobiles consistently outperform both averages. The connect rate benchmark for a team using only verified direct dials should be above 12%, not 7–9%.
Lusha’s phone accuracy
Lusha reports 85% phone accuracy for direct dials and mobile numbers — the verification methodology checks that numbers are current and route to the correct contact. At 85% accuracy, a list of 100 direct dials produces 85 verified connections and 15 stale or incorrect numbers. That is materially better than a general line approach, where 60–80% of dials never reach the right person at all.
Contact coverage benchmarks
Why contact coverage determines deal outcome
47% of deals lost in B2B sales were single-threaded — meaning the selling team had one active relationship at the account and lost the deal when that relationship went cold, changed roles, or left the company, according to TechTarget’s 2024 research.
Gong’s 2024 data puts the performance gap in concrete terms: deals where three or more stakeholders are actively engaged close at 2.8x the rate of deals where only one contact is involved.
The benchmark is not complicated. Three verified contacts per active deal is the minimum for enterprise deals. Two is acceptable. One is a pipeline risk.
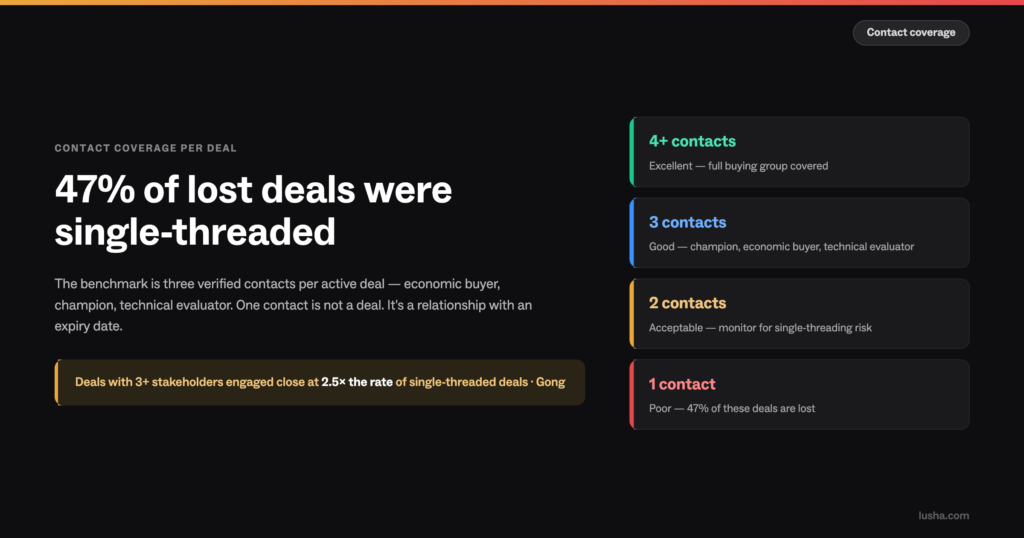
The contact coverage benchmarks
| Contacts per active deal | Status | Close rate impact |
|---|---|---|
| 4+ verified contacts | Excellent | Full buying group covered |
| 3 verified contacts | Good | Champion + economic buyer + technical evaluator |
| 2 verified contacts | Acceptable | Champion + one other — monitor for single-threading risk |
| 1 contact | Poor | Single-threaded — 47% of deals in this position are lost |
| 0 current contacts | Critical — departed contact undetected | Deal is effectively dead |
The buying group minimum
A complete buying group for a typical B2B deal requires four roles covered:
- Economic buyer — signs the contract, controls the budget
- Champion — internal advocate, runs the evaluation
- Technical evaluator — assesses integration and security
- Procurement — reviews vendor contracts before signature
Most deals enter the pipeline with only the champion mapped. The economic buyer is typically not identified until the proposal stage — by which point the rep has been working a deal without knowing who approves it.
Lusha’s database covers 1,175,194 VP and Director-level sales and operations contacts with verified email and phone — the seniority range where economic buyers and champions are most commonly found.
The single-threading problem
62% of sales reps say stale data has cost them a deal, according to Salesforce’s 2024 State of Sales report. The most common mechanism is not a bounced email — it is a departed champion on an active deal that the rep discovers during a call rather than in advance.
The fix is contact validation before every stage gate advancement, not after a departure is discovered. At Lusha’s scale, that validation takes seconds per contact.
CRM data quality benchmarks
The accuracy floor
| CRM data accuracy | Status | Action |
|---|---|---|
| 95%+ records current | Excellent | Standard refresh cadence sufficient |
| 90–95% records current | Good | Quarterly refresh — monitor for drift |
| 80–90% records current | Acceptable | Quarterly refresh mandatory |
| Below 80% records current | Poor — refresh required | Immediate Tier 1 validation before any outreach |
| Unknown | No process — high risk | Establish baseline immediately |
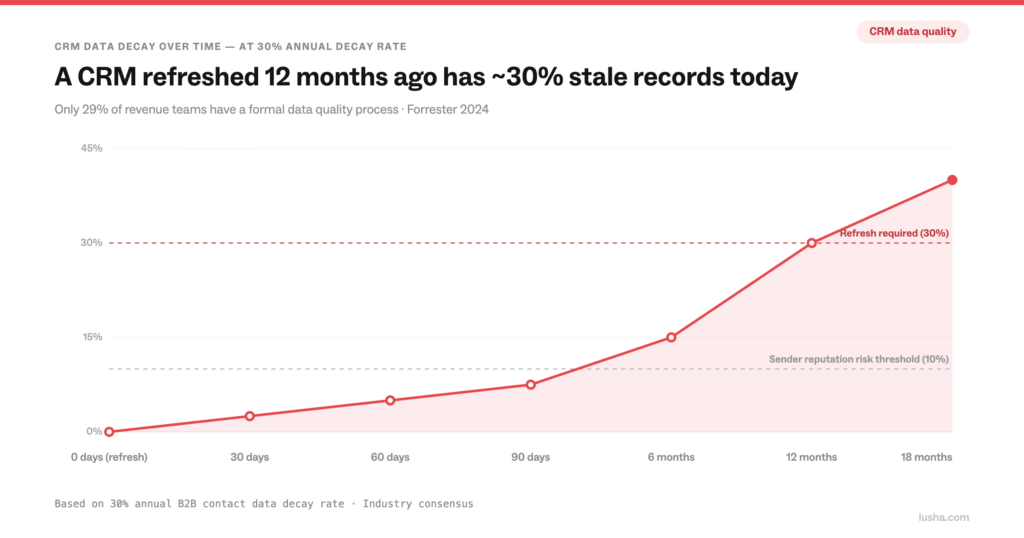
Only 29% of revenue teams have a formal data quality process, according to Forrester’s 2024 research. That means 71% of revenue teams are operating with an unknown CRM data accuracy level — some well above the floor, many below it.
The decay math
Contact data decays at roughly 30% per year. At that rate:
| Time since last refresh | Expected stale records |
|---|---|
| 30 days | ~2.5% stale |
| 60 days | ~5% stale |
| 90 days | ~7.5% stale |
| 6 months | ~15% stale |
| 12 months | ~30% stale |
| 18 months | ~40%+ stale |
A CRM that was fully refreshed 12 months ago has roughly 30% stale records today — before accounting for any new contacts added since the refresh.
The refresh cadence benchmark
| Contact tier | Benchmark cadence | Rationale |
|---|---|---|
| Primary contacts on active deals | Monthly | A departed champion mid-deal is the highest-cost data failure |
| Contacts on open pipeline, no active deal | Quarterly | 7–8% decay per quarter — catch it before outreach |
| Territory contacts not yet worked | Quarterly or before first outreach | Validate before sending, not after bouncing |
| Campaign lists | Before every send | A 60-day-old list has ~5% stale rate — 500 invalid sends per 10K contacts |
| Dormant or archived contacts | Annually or before any reactivation | No point refreshing what isn’t being used |
What 21% of marketing budget buys
Experian’s 2024 research puts the average percentage of marketing budget wasted on bad data at 21%. For a team with a $500K annual marketing budget, that is $105,000 in wasted spend per year — emails to invalid addresses, calls to disconnected numbers, campaigns to contacts who left the company months ago.
The cost of a data verification layer is typically a fraction of the waste it prevents.
Signal monitoring benchmarks
What active signal monitoring looks like
Based on Lusha’s Q1–Q2 2026 signal data:
| Signal type | Global volume Q1–Q2 2026 | Per working day | Response window |
|---|---|---|---|
| Executive hire (VP+) | 37,518 companies | 347 | 7–14 days |
| Financial events (funding, investment) | 21,353 companies | 198 | 14–30 days |
| Hiring surge (15%+) | 1,045,626 companies | 9,682 | 30 days |
A revenue team covering 1,000 target accounts should expect to see roughly 3–4 executive hire signals and 2 financial event signals per week — if their signal monitoring is running. Most teams are not monitoring signals at all, which means these windows open and close without a conversation happening.
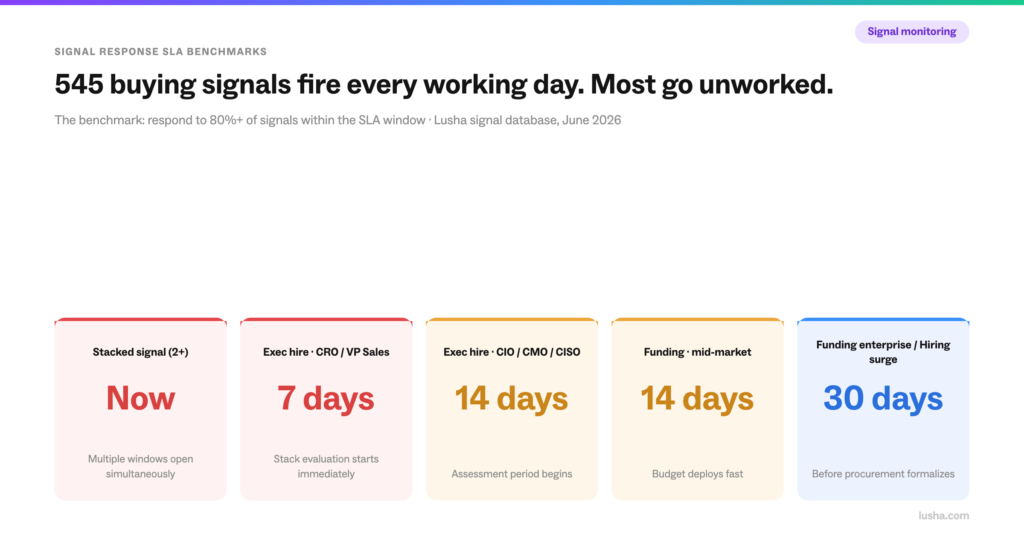
The benchmark: signal response SLA
| Signal type | Response SLA benchmark | What happens if missed |
|---|---|---|
| Executive hire — CRO / VP Sales | 7 days | New leader forms vendor opinions — shortlist starts without you |
| Executive hire — CIO / CMO / CISO | 14 days | Stack evaluation begins — early conversations shape the view |
| Funding event — mid-market | 14 days | Budget allocated, deployment plan set |
| Funding event — enterprise | 30 days | Procurement process formalizes |
| Stacked signal (2+ types) | Immediate | Multiple windows open simultaneously — highest urgency |
Pulling it together: the benchmark scorecard
A revenue team operating at benchmark across all five categories looks like this:
| Category | Benchmark | Measurement |
|---|---|---|
| Email deliverability | 97%+ | Bounce rate under 2% on outbound campaigns |
| Phone connect rate | 12%+ | Direct dials only — no general lines on active deals |
| Contact coverage | 3+ contacts per active deal | Champion, economic buyer, technical evaluator all mapped |
| CRM data accuracy | 90%+ records current | Validated monthly for Tier 1, quarterly for Tier 2 |
| Signal monitoring | SLA met on 80%+ of signals | Response within the window for each signal type |
Most teams are operating below benchmark on at least three of these five. The gap is almost always a data quality problem before it is a messaging or process problem.
Lusha data pulled June 1, 2026. Third-party benchmarks: Gong 2024, Salesloft 2024, Forrester 2024, Salesforce State of Sales 2024, Experian 2024. Run a live Lusha query to validate contact data against any of these benchmarks for your specific territory.